
The sales team plays a crucial role for any business, as it remains engaged not only in sales but also devises marketing strategies, directly interacts with end users, and proactively handles leads to enhance revenue.
All such activities increase the workload on the sales team, which could be subsided using technology.
This is the reason why most organizations prefer to use business intelligence tools, which equip them with adequate technical and professional support to remain one step ahead of their opponents.
As per Finances Online, 90% of marketing and sales teams stated that they have improved their work efficiency and effectiveness using the BI tools.
Similarly, a customized BI sales dashboard empowers sales representatives to gain vital insights and make the correct decisions.
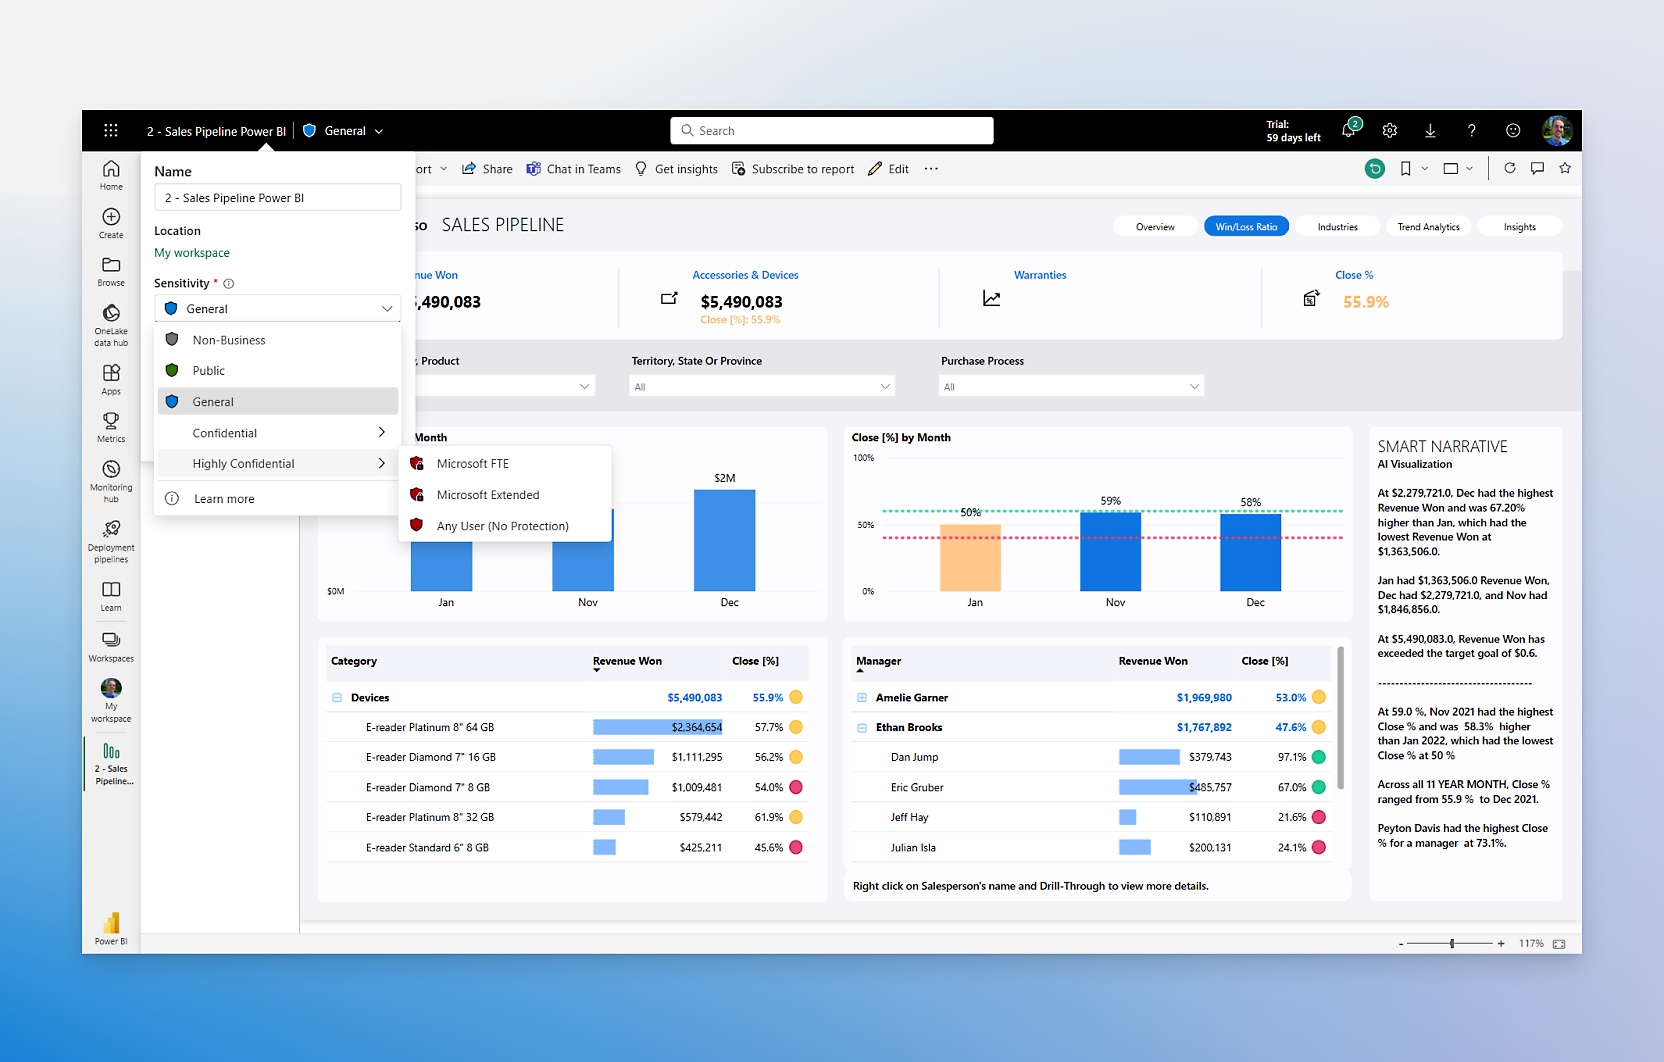
Microsoft Power BI is among the most popular and widely used BI tools globally. If you develop and customize a Power BI sales dashboard for your business, then you can expect better monitoring of leads, enhanced revenue, reduced expenses, satisfied customers, increased profits, and other key performance indicators (KPIs) in real-time.
In this blog, we are going to discuss how to create sales dashboards in Power BI and various steps to configure them for your sales team. We will also explore the advantages of using Power BI sales dashboards and some important tips for using them effectively.
Power BI is a revolutionary product developed by Microsoft. It is a modern, scalable platform for enterprise business intelligence and self-service.
It offers a bouquet of software services, connectors, and applications that work together to translate your raw and unstructured data into visually immersive, intelligible, and highly interactive insights.
Creating a Power BI sales analysis dashboard is indeed a complex task. You should be aware of your long-term objectives and KPIs beforehand. You need to consider the following aspects before setting up a sales performance dashboard for your sales pipeline:
The efficacy of Power BI reports depends on the accuracy of your KPIs and how effectively dashboard customization is aligned with your organization’s business objectives.
There are numerous compelling reasons to leverage Power BI Sales Dashboards for gaining deep and actionable sales insights:
Ditch static spreadsheets and clunky reports. Power BI dashboards bring your sales data to life with dynamic visuals, charts, and graphs, updating in real-time to reflect the latest trends and fluctuations.
This immediacy enables faster reaction times and better decision-making based on the most current information.

No more hunting through scattered data sources. Power BI consolidates all your sales data from various sources (CRM, ERP, marketing platforms) into a single, unified performance dashboard.
This provides a holistic view of your sales performance, allowing you to track critical metrics like sales figures, pipeline stages, conversion rates, and customer trends—all in one place.
Power BI goes beyond just displaying high-level overviews. It empowers you to delve deeper into specific aspects of your sales data.
Use filters to isolate regions, products, teams, or timeframes to understand granular performance and identify areas for improvement.
Gain clarity in your sales pipeline with visual representations of deal stages, values, and conversion rates. Identify bottlenecks, optimize your sales process, and predict future performance with greater accuracy.
Understand your customer base better than ever. Power BI dashboard services help you identify top customers, analyze product preferences, and track geographic trends.
This actionable customer data allows you to personalize your approach, optimize marketing campaigns, and boost customer retention.
Share your Power BI sales analytics dashboard with your entire sales team, fostering collaborative data analysis and knowledge sharing. Everyone can access the same real-time insights, leading to more informed and aligned decisions across the organization.
By identifying trends, spotting anomalies, and optimizing processes, a customized sales dashboard helps you streamline your sales operations, Improve resource allocation, prioritize lead generation efforts, and focus your sales team on the most promising opportunities.
Move away from gut feelings and intuition. Power BI equips you with the data-driven insights necessary to make strategic decisions about pricing, product offerings, marketing campaigns, and resource allocation. This data-backed approach leads to more effective and impactful sales strategies.
Stay on top of your sales performance, even on the go. Microsoft Power BI dashboards are accessible on mobile devices, providing you with instant access to vital insights and empowering you to make informed decisions anytime, anywhere.
Power BI goes beyond numbers and data points. It’s dynamic visuals and storytelling capabilities help you present your sales insights compellingly and understandably.
This makes data more accessible and engaging for all stakeholders, promoting understanding and buy-in for your sales initiatives.
Setting up a Power BI Sales Dashboard involves several key steps, from data preparation to visualization and sharing.
Here’s a breakdown:
You need to create a Power BI account by clicking on the ‘Try Free’ button on the Microsoft Power BI portal. You can provide the required information or use your existing Microsoft 365 login details to create an account.
Once you complete the profile creation process, you can follow the below instructions to proceed further.
Here, we need to connect the data sources.
This step contains various operations to make changes in your data.
If you are planning for third-party integrations, then you can use a specific tool, connect your database, and then follow the tool-specific instructions to embed your dashboard with other platforms.
This is a strictly optional step. You can register an app with Microsoft Power BI, get an app ID, and generate a code to develop your app.
Unlocking the full potential of your Power BI Sales Dashboard requires more than just setting it up.
Here are some key tips to ensure you’re extracting maximum value and driving actionable insights:
Don’t overload your dashboard with every available data point. Prioritize the metrics that directly impact your sales goals and decision-making. Less is often more when it comes to clarity and focus.
Consider who will be using your dashboard most often. Create tailored views for executives, sales reps, and marketing teams, highlighting metrics relevant to their specific roles and responsibilities.
Go beyond static visuals. Use filters, slicers, and drill-down capabilities to empower users to explore the data independently, uncovering hidden trends and patterns.
Employ dynamic charts, graphs, and maps to tell the story behind your data in a visually appealing way. Utilize color effectively and maintain a consistent design aesthetic for user comfort.
Schedule regular data refreshes to ensure your dashboard reflects the latest information. This keeps everyone informed and avoids basing decisions on outdated metrics.
Promote the use of your dashboard across the organization. Encourage discussion and analysis of the insights it provides, and integrate data-driven decision-making into your sales team’s workflow.
Continuously monitor the effectiveness of your dashboard. Track how it’s influencing sales performance and decision-making, and make adjustments as needed to optimize its impact.

Businesses across the world have been using Data visualization tools to track their sales KPIs and various other parameters to make the right decisions to increase their sales revenue.
A customized sales dashboard can offer you deep insights and actionable information that empowers your sales team to make well-informed decisions.
Instead of developing an app from scratch, you can leverage the capabilities of renowned platforms such as Microsoft Power BI to streamline your business processes.
With Power BI, you can effectively analyze your sales data and identify opportunities, patterns, and trends that can help you develop an optimized sales strategy and improve your business growth.
If you are planning to kick-start your Power BI journey, then get in touch with our seasoned Power BI consultants. Arka Softwares is a prestigious Power BI consulting services provider that offers a whole range of Power BI Sales services.
We can assist you as a Power BI consulting partner and offer you a one-stop solution for all of your Power BI sales reporting requirements.


Jeeto11
The app quickly earned over 1,000 downloads within two months of launch, and users have responded positively. ARKA Softwares boasted experienced resources who were happy to share their knowledge with the internal team.

Archithrones
While the development is ongoing, the client is pleased with the work thus far, which has met expectations. ARKA Softwares puts the needs of the client first, remaining open to feedback on their work. Their team is adaptable, responsive, and hard-working.

Service Provider
I started my project with Arka Softwares because it is a reputed company. And when I started working with them for my project, I found out that they have everything essential for my work. The app is still under development and but quite confident and it will turn out to be the best.


